Although we could add another EWA web part to our
page to display the underlying data for our chart, doing so would
introduce unnecessary overhead since we don’t need any level of
interactivity with the data. Notwithstanding our unquestioned dedication
to ensuring optimum performance at all times, another really good
reason for not adding a second EWA web part is to give us an opportunity
to explore the new REST API that ships with Excel Services 2010.
Excel Services REST API Syntax
The REST API, provides a lightweight mechanism for accessing
content within Excel workbooks that have been published using Excel
Services. In effect, accessing data using a REST-ful service comes down
to using the correct URL, and for the Excel Services REST API, the URL
format is
http://<RootUrl>/_vti_bin/ExcelRest.aspx/<Filename>/model/<Selector>?<Parameters>.
RootUrl
The RootUrl value contains the URL of the SharePoint site containing the workbook. In our case, this will be http://localhost/Example.
Filename
The Filename
value contains the relative path to the Excel workbook. In our case,
this will be Excel Workbooks/Last30DaysSales.xlsx. However, since we’re
creating a URL, we need to encode the space in Excel Workbooks. This
value then becomes Excel%20Workbooks/Last30DaysSales.xslx.
Selector
The Selector value is where the fun begins in the REST URL. Let’s run through a quick demonstration of how it works.
If you enter the following URL into a web browser, you’ll see a page listing the types of data available within the model:
http://localhost/Example/_vti_bin/ExcelRest.aspx/Excel%20Workbooks/Last30DaysSales.xlsx/model
As you can see, in the case of Excel, the types available are Ranges, Charts, Tables, and PivotTables.
You can build up the selector
value by first deciding in which type of data you’re interested. In our
case, it’s Charts. Enter the following URL into a web browser to see a
list of available charts:
http://localhost/Example/_vti_bin/ExcelRest.aspx/Excel%20Workbooks/Last30DaysSales.xlsx/model/Charts
From the returned data, you can
see that our workbook contains only one chart, Chart 1. Let’s create a
selector for the Chart 1 object. In the browser, enter the following
URL:
http://localhost/Example/_vti_bin/ExcelRest.aspx/Excel%20Workbooks/Last30DaysSales.xlsx/model/Charts(‘Chart%201’)
Notice that this simply specifies that you want Chart 1 from the Charts collection. Again the space is encoded in the name Chart 1 since we’re building a URL. This time the browser will display a Portable Network Graphics (PNG) image representing our chart.
Parameters
The Parameters
value allows us to pass values into Excel Services as part of our
request. For example, our workbook defines a named range called
CurrencyCode. The value of CurrencyCode is used to produce the chart
title, so by changing CurrencyCode as part of our REST URL, our chart
title will change as well. To see this in action, in the browser, enter
the following URL:
http://localhost/Example/_vti_bin/ExcelRest.aspx/Excel%20Workbooks/Last30DaysSales.xlsx/model/Charts(‘chart%201’)?Ranges(‘CurrencyCode’)
=MyCurrencyCode
You can see that the chart has been produced with a label that reads Last 30 Days Sales in MyCurrencyCode.
Retrieving a PivotTable Using REST
Now that you understand how a
REST URL can be generated, let’s put this knowledge to good use by
creating a URL that we can use to include data from our PivotTable on
our sample site home page.
If we enter the following URL in the browser, we’ll get a 404 error:
http://localhost/Example/_vti_bin/ExcelRest.aspx/Excel%20Workbooks/Last30DaysSales.xlsx/model/PivotTables(‘PivotTable1’)
Before we can access items
using the REST API, we need to make sure that we’ve published the
appropriate metadata from the Excel client. You’ll remember earlier that
we didn’t select any of the PivotTables in our list of items, and
that’s why we’re seeing a 404 error now.
Switch
back to the Excel client application. Before we publish our
PivotTables, let’s give them useful names. Switch to Sheet3 and then
click anywhere within the PivotTable.
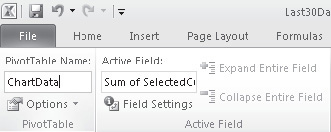
From the PivotTable Tools tab, select the Options menu. In the PivotTable section, in the PivotTable Name box, type ChartData, as illustrated:
Switch to Sheet1 and type the name of the PivotTable as SourceData.
We’ll
add an additional PivotTable to summarize our sales figures. Add a new
worksheet named Sheet4. Insert a new PivotTable that makes use of
SourceDataTable as its data source.
Add OrderDate as a RowLabel and SelectedCurrencyValue as a Value.
Right-click
the Sum of SelectedCurrencyValue column header, and then select Value
Field Settings. In the Custom Name text box, type Total Sales.
Name the new PivotTable TotalSalesData.
Click the File menu to enter the backstage area, and then click the Publish To Excel Services button in the Share section.
Click the Excel Services Options button, and then select All Pivot Tables in the Items In The Workbook section.
Save the workbook to update the metadata.
We can now enter the following URL in the browser and see an HTML representation of our chart data:
http://localhost/Example/_vti_bin/ExcelRest.aspx/Excel%20Workbooks/Last30DaysSales.xlsx/model/PivotTables(‘TotalSalesData’)
Using REST-Generated Content Within a Web Part Page
Now that we have a URL, the
next step is to make use of that on our home page. The easiest way to
include additional content on the page is to use a PageViewer web part.
From the SiteActions menu, select Edit Page.
Click Add a Web Part in the Right web part zone, and then select the Page Viewer web part from the Media and Content category.
Set the Link property of the Page Viewer web part to the REST API URL for our TotalSalesData PivotTable.
Click OK to commit the changes, and then click Stop Editing from the Page ribbon to return to view mode.
We’ve
now created a user interface for our sales data that allows users to
filter data by territory. As well as using the EWA web part, we’ve also
included content generated using the REST API on our page via a Page
Viewer web part. All of the items presented in the user interface are
dynamically generated based on data from an external data source. As the
underlying data changes, the user interface will be automatically
updated to reflect those changes. Bear in mind, so far, we haven’t
written a single line of code.